PREA Quarterly Feature - Winter 2024


 Daniel O'Connell
The Townsend Group
In 2023, private real estate valuations finally hit the reset button. After a decade of low interest rates and cap rate compression, private real estate valuations declined in 2023 as a result of unprecedented interest rate increases. Policies enacted by the US Federal Reserve and global central banks to raise interest rates and fight inflation created a domino effect of private real estate valuation declines, driven by rising fixed income yields and the rising cost of debt.
The following article summarizes the appraisal processes appraisers and commercial real estate portfolio managers use; reviews the impact of rising interest rates on private real estate valuations, performance, and transaction volume; and reviews today’s private real estate valuations versus those of the public sector.
Real Estate Fund Valuation Process
Appraisal Process
Understanding the appraisal process for private real estate is important because it provides context to valuations. In the US, there are two major third-party appraisal firms: Altus Group and Situs AMC. Within the NCREIF Fund Index—Open End Diversified Core Equity (NFI-ODCE), Altus provides third-party appraisal services for 23 of the 25 current index constituents, and Situs provides services for two funds that represent a fairly large portion of the index. Both Altus and Situs employ similar appraisal processes. In general, it is common practice for all assets within each fund to be appraised quarterly by an independent third-party appraiser. Typically, open-end fund managers engage a third-party firm to appraise approximately 25% of a fund’s real estate investments each quarter (after the fund owns an asset for 12 months). This allows the entire portfolio to be externally appraised each year. Internal valuation adjustments are made on the non-externally appraised assets on a quarterly basis. Third-party appraisals provide fund managers analysis, with the cost, sales, direct capitalization, and discounted cash flow methodologies utilized in the valuation.
Valuation Policies for Closed-End Funds
Unlike for funds in the NFI-ODCE, appraisers do not have a standard practice for appraising investments in closed-end funds. Although some funds employ third-party valuation firms, most typically utilize in-house resources for quarter-to-quarter valuations. Some utilize external appraisals on a rotating basis (most commonly so no investment goes more than three years without an external valuation). In most cases, a fund’s independent auditor provides a reasonableness check on valuations and the valuation process as a part of annually audited financials. Because of the value-added / value-creation nature, shorter-term asset holds, and lack of liquidity of closed-end funds, appraisals on a regular basis are often not cost effective.
A Note on European Valuations and Faster Repricing
Throughout 2023, valuations in Europe repriced noticeably faster than those in the US, especially in the UK. In Europe, valuations aren’t solely reliant on transactions because appraisals also consider sentiment indicators. As transaction volumes fell, sentiment exerted a greater influence over valuation movements. In 2023, UK valuers were more proactive in marking down valuations when transaction volume was lacking. Outside the UK, countries largely utilized a discounted cash flow model to approximate valuations. However, this model tended to output smaller adjustments in valuations versus sentiment indicators. Notably, the secondary market for trading in and out of open-end funds in Europe is more active, which may provide further evidence for pricing.
Altus Group Survey Findings
In 2023, Altus conducted the CRE Industry Conditions and Sentiment Survey, aggregating feedback from more than 176 respondents, representing at least 47 different firms within the US. Respondents included investment managers, private equity managers, REITs, asset management companies, service providers, life companies, pension plans, lenders, and other individuals. Regarding private real estate valuations, key findings included the following:
- Greater than 80% of respondents noted moderate to significant expectations for expansion of cap rates, indicating decline in valuations.
- Of the four major sectors within the NFI-ODCE (office, residential, industrial, and retail),
- 68% of respondents indicated that valuations for office were priced too high
- 45% of respondents indicated that valuations for residential were priced too high
- 36% of respondents indicated that valuations for industrial were priced too high
- 20% of respondents indicated that valuations for retail were priced too high
How did the private real estate industry reach these conclusions? The next section discusses the impact of rising interest rates globally and how investor demand for private real estate changed to reflect the rise in Treasury and fixed-income yields.
Rising Interest Rates and Valuation Impact
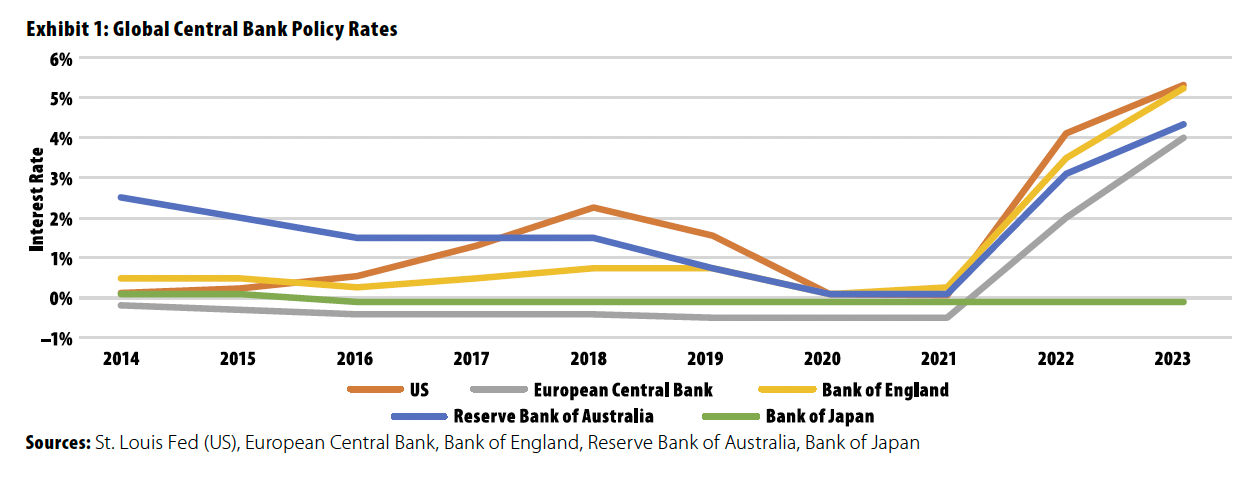
As inflation began to rise in 2021, central banks across the globe began increasing interest rates to slow its growth. According to the US Bureau of Labor Statistics (BLS), as the labor market tightened during 2021 and 2022, core inflation rose as the ratio of job vacancies to unemployment increased. This ratio is used to measure wage pressures that then pass through to the prices for goods and services. In general, as workers bargain for better pay, firms begin to increase prices. From this research, the BLS noted that three main components explained the rise in inflation since 2020: volatility of energy prices, backlogs of work orders for goods and services caused by supply chain issues due to COVID-19, and price changes in the auto-related industries.
Exhibit 1 highlights the increase in central bank policy rates across the globe. As interest rates increased, a major sell-off of fixed income instruments globally caused a sharp rise in yields. Because private real estate is primarily an income-generating investment, investors sought higher income returns from private real estate to justify the risk premium of investing in real estate versus government-backed Treasuries and low-risk, fixed-income instruments. This led to a valuation reset in private real estate values.
Valuations
In the US, the ten-year Treasury yield is widely used as the risk-free performance benchmark. At the start of 2022, the ten-year Treasury yield began increasing at a fast pace, reaching above 5% by October 2023 before moderating back to 4% by year-end 2023. Meanwhile, private real estate had reached peak pricing in the third quarter of 2022, trading at a weighted average cap rate of 3.7%. As the spread widened between the ten-year Treasury yield and private real estate cap rates, cap rates began expanding in the fourth quarter of 2022 and reached 4.3% in the third quarter of 2023.
Exhibit 2 shows the relationship between the ten-year Treasury and private real estate cap rates. Historically, when the spread falls below +100 basis points (bps), cap rates have expanded.

Another comparison to review is the relationship between private real estate cap rates and the BBB corporate bond yield. The BBB yield is often used as a guide to the cost of financing. Although US core open-end commingled funds generally employ low leverage (NCREIF limits NFI-ODCE constituents to a 35% loan-to-value ratio), rising financing costs have a weighing impact on real estate valuations and transactions.
Exhibit 3 shows the relationship between BBB yields and private real estate cap rates. Historically, when BBB corporate bond spreads turn negative, cap rates have expanded (financing at a higher interest rate than the going-in cap rate implies negative leverage at the onset of the asset’s acquisition).
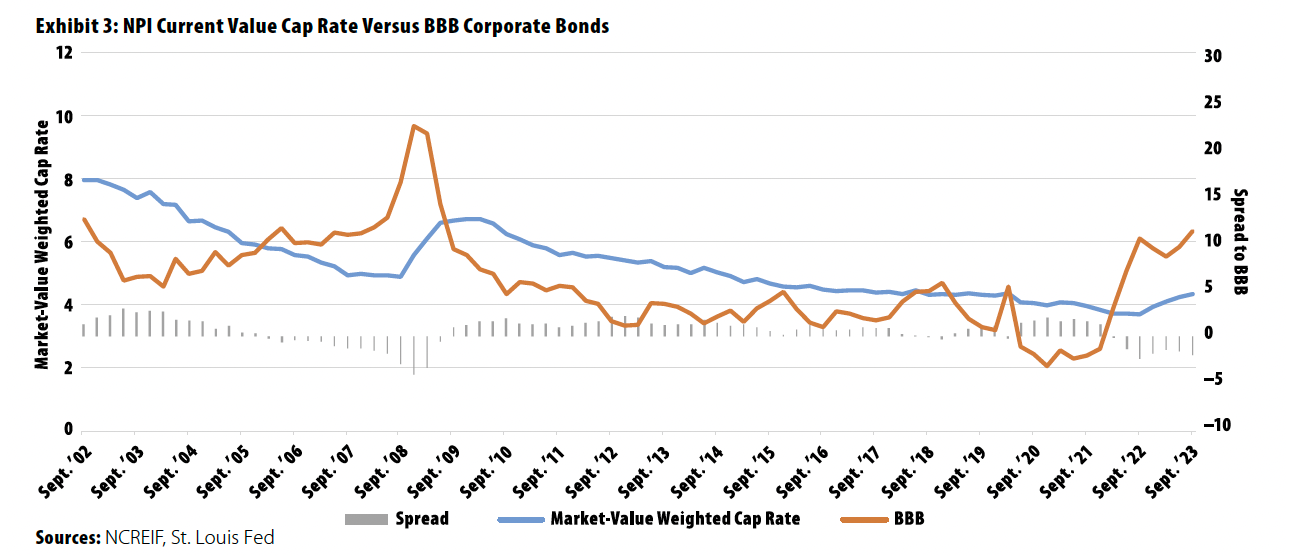
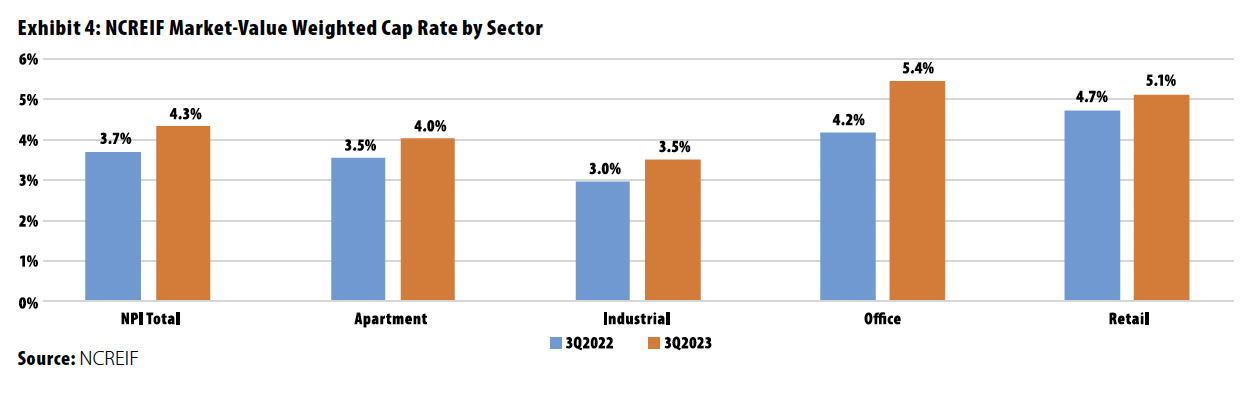
Exhibit 4 highlights the NPI market-value weighted cap rates by sector. Guidance from Altus and real estate portfolio managers suggests that cap rates will continue to expand into early 2024.
Performance
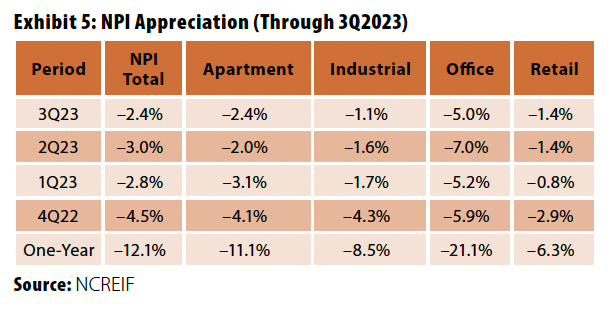
Like bond prices, real estate valuations and yields are inversely related. As cap rates expand, valuations decline. Exhibit 5 highlights the valuation declines seen throughout private real estate over the trailing 12-month period.
The NPI generated a total return of –8.4% (gross) over the trailing one-year period. Note that the total returns in Exhibit 5 include income generated from private real estate. To capture the bigger picture, it is also important to review appreciation (or in this case, depreciation).
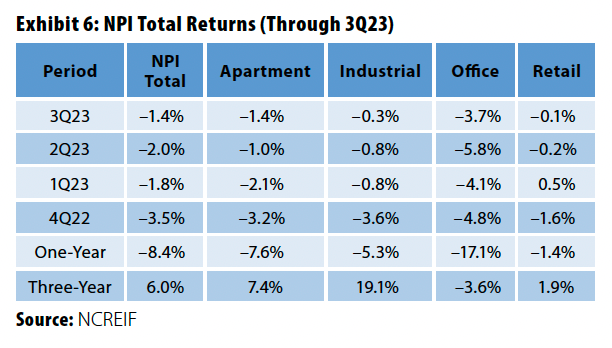
As indicated in Exhibit 6, value declines varied by asset class. This was largely determined by the macro fundamentals of each sector. Most notably, office had the largest valuation change as the sector underwent challenges with tenant vacancy and debt financing.
Rising Interest Rates and Transaction Volume Impact
Transaction Volume
Real estate valuations are ultimately defined by transaction pricing. Transaction volume moderated considerably from 2021 through 2023 as rising interest rates pushed the cost of borrowing above the current market cap rates, causing the decline of leveraged buyers for private real estate. Shrinking buyer pools, coupled with limited capital inflows into private real estate, caused pricing discovery to lag the movement of Treasury and bond yields. Indicative of the valuation data presented earlier, cap rates did not experience meaningful expansion until 2023. As of the third quarter of 2023, transaction volume was down –44% year over year, according to MSCI Real Assets.
Financing Rates (January 2024)
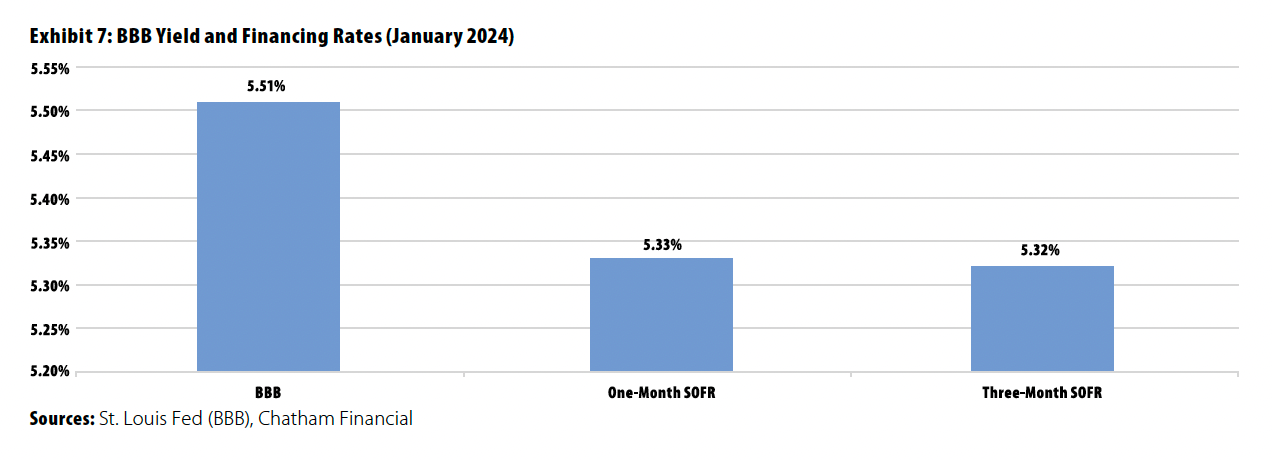
For real estate debt, market interest rates are determined by the risk-profile of the real estate asset and lending rates. Exhibit 7 highlights Secured Overnight Financing Rates (SOFR). Based on guidance from portfolio managers in the US, floating rate financing is being underwritten at ranges of SOFR +150 bps to 400 bps and fixed-rate financing is being underwritten at all-in interest rates in the mid-5% to high-6% range, depending on the risk profile of the asset. Higher-risk asset classes, such as office, are unable to obtain financing from traditional lenders and must seek expensive financing from third-party capital sources.
Forward curves published by Chatham Financial show financing rates declining through 2025, with SOFR financing declining to approximately 3.3%. Please note there is no guarantee SOFR rates will decline to this level.
Private Real Estate Versus Public REITs
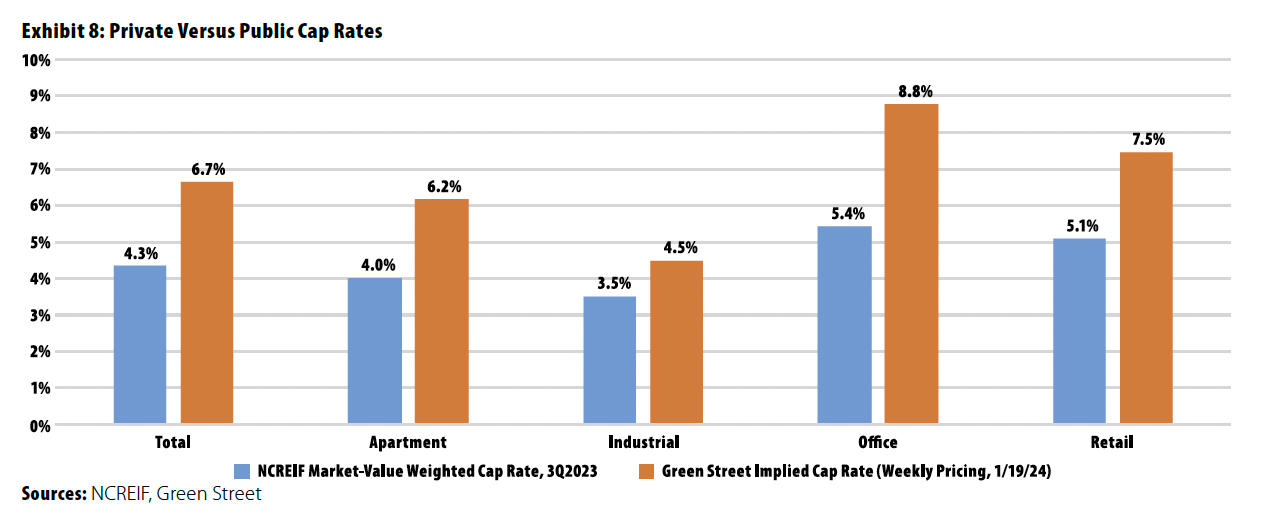
Although the private real estate valuation reset continues into 2024, REITs today exhibit a cap rate premium that may be indicative of future pricing (Exhibit 8). As of the third quarter of 2023, private real estate valuations exhibited an implied discount of –20% to 40%, depending on the sector. Historically, private real estate valuations have lagged REIT valuations by about three to four quarters because of the timing of the appraisal process versus daily pricing in the public markets.
Looking Ahead
Fourth-quarter preliminary performance guidance for the NFI-ODCE indicates a total gross return of –4.8% during the quarter, with the index delivering approximately a –12.0% total gross return for 2023. This compares to the MSCI US REIT Index, which generated a one-year gain of 13.7% in 2023. Using REIT performance as a potential guide for private real estate values, the MSCI US REIT index was down –24.5% in 2022. Private real estate fund redemption queues began increasing in 2022, driven primarily by the denominator effect of public market declines, but limited transaction volume resulted in limited redemption payouts in 2023, and these queues are expected to persist through 2024. Based on current valuations and public market pricing, many research sources are predicting further declines in values in the first half of 2024 before returning to historical return expectations in 2025. 
Daniel O’Connell is an Associate Partner at The Townsend Group.
This article has been prepared solely for informational purposes and is not to be construed as investment advice or an offer or a solicitation for the purchase or sale of any financial instrument, property, or investment. It is not intended to provide, and should not be relied upon for, tax, legal, or accounting advice. The opinions, estimates, forecasts, and statements of financial market trends are subject to change without notice due to changes in the market or economic conditions. We believe the information provided here is reliable, but do not warrant its accuracy or completeness. The information contained herein reflects the views of the author(s) at the time the article was prepared and will not be updated or otherwise revised to reflect information that subsequently becomes available or circumstances existing or changes occurring after the date the article was prepared. Townsend Holdings LLC is a federally Registered Investment Advisor with the U.S. Securities and Exchange Commission.