PREA Quarterly Feature - Fall 2023


 Paul Fiorilla
Yardi Matrix
Facing decelerating rent growth and deteriorating capital markets conditions, multifamily owners also face rapid growth in expense costs, led by skyrocketing insurance costs in markets that are being hit by frequent weather-related damage events.
Expenses for multifamily properties nationally grew by an average of 9.3% in the trailing 12-month period ending mid-year 2023, which is 63% higher than the 5.7% increase during the previous 12-month period, according to a study of Yardi Matrix expert data. By far the biggest increase was in insurance, which rose an average of 18.8% in the 12 months ending June 2023, per Yardi. Other expense categories with above-trend growth included repairs and maintenance (14.4%), administrative (11.8%), and utilities and payroll (both 7.8%).
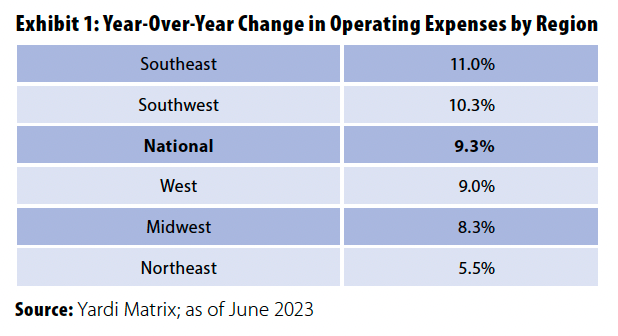
As shown in Exhibit 1, expenses generally increased more in areas of the country that have lower costs. In the period studied, expenses rose the most in the Southeast (11.0%), where average annual expenses per unit were $8,141, and Southwest (10.3%), where expenses per unit averaged $8,144. Both were well below the national per-unit average operating expense of $8,694. Expenses rose only 5.5% in the Northeast, which had the highest expenses per unit of $11,251, and 9.0% in the West, where expenses averaged $9,325 per unit.
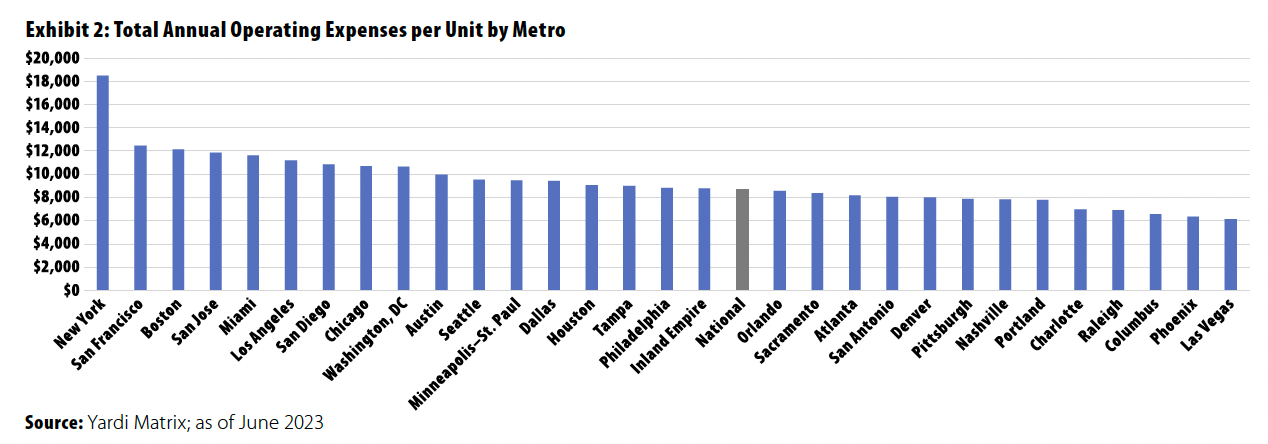
To be sure, property owners generally came out ahead during the period studied. The increase in expenses in the year ending June 2023 represented $740 in additional costs per unit at the average US multifamily property, while the average property operating expense rose by $838 to $8,694 per year per unit (Exhibit 2), according to Yardi.
However, headwinds are on the horizon that could spell trouble if expense growth continues at the same rate. Rent growth is decelerating as the post-pandemic growth in household formation begins to lose steam. The average US rent growth fell to 0.8% year over year as of September, per Yardi, the lowest level since the pandemic stalled growth in early 2021, and growth is negative in almost half the largest 30 markets. Meanwhile, supply growth is hitting decades-long highs. More than 1.1 million units are under construction nationally, and Yardi forecasts roughly 900,000 units will be delivered through the end of 2025.
Property owners also face the impact of higher interest rates, which includes lower property values and higher costs of debt. The MSCI/PREA US ACOE Quarterly Property Fund Index fell 10.7% in the four quarters ending 2Q2023, including a 16.6% decrease in office and a 6.3% drop in multifamily. Property values are expected to drop further as rates remain high and demand softens as the economy slows. Mortgage coupons have bounced from historical lows of 3% to 4% in 2020 and 2021 to 6% to 8% or more in 4Q2023. The market is anticipating an increase in distress as property owners refinancing maturing low-rate loans face capital shortfalls or negotiations with banks to extend current debt.
So although the increase in expenses is not at first blush a serious hurdle for property owners, it could prove to be more than a minor headache if expenses continue to increase at above-trend levels while property income flatlines.
Expense Growth Most in Smaller Metros
To get a handle on rising expense growth, Yardi Matrix tabulated expenses by category and geographic area by aggregating property data on more than 20,000 properties with more than 5 million units that used Yardi accounting software. The increase in expenses in the trailing 12-month period ending in June 2023 was broken down. The results found that expense growth was widespread; operating expenses increased between 5.0% and 14.9% in 85% of US multifamily properties in the previous year, per Yardi.
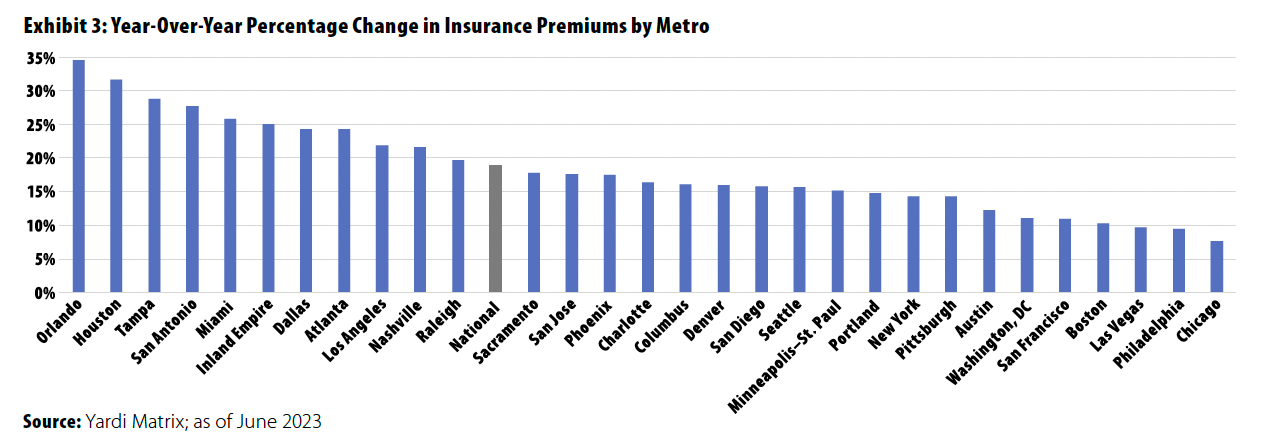
Total operating expenses increased by 9.3% on a trailing 12-month basis nationally. By category, insurance recorded the largest increase at 18.8% (Exhibit 3), followed by repairs/maintenance (14.2%), administrative (11.8%), payroll and utilities (both 7.8%), management (7.2%), taxes (5.9%), and marketing (4.9%). The rapid growth reflects national inflation trends, such as the increasing number of weather-related events that cause property damage, the tight labor market that is driving up employee wages, growing energy costs, and supply chain issues that increase the cost of materials and appliances.
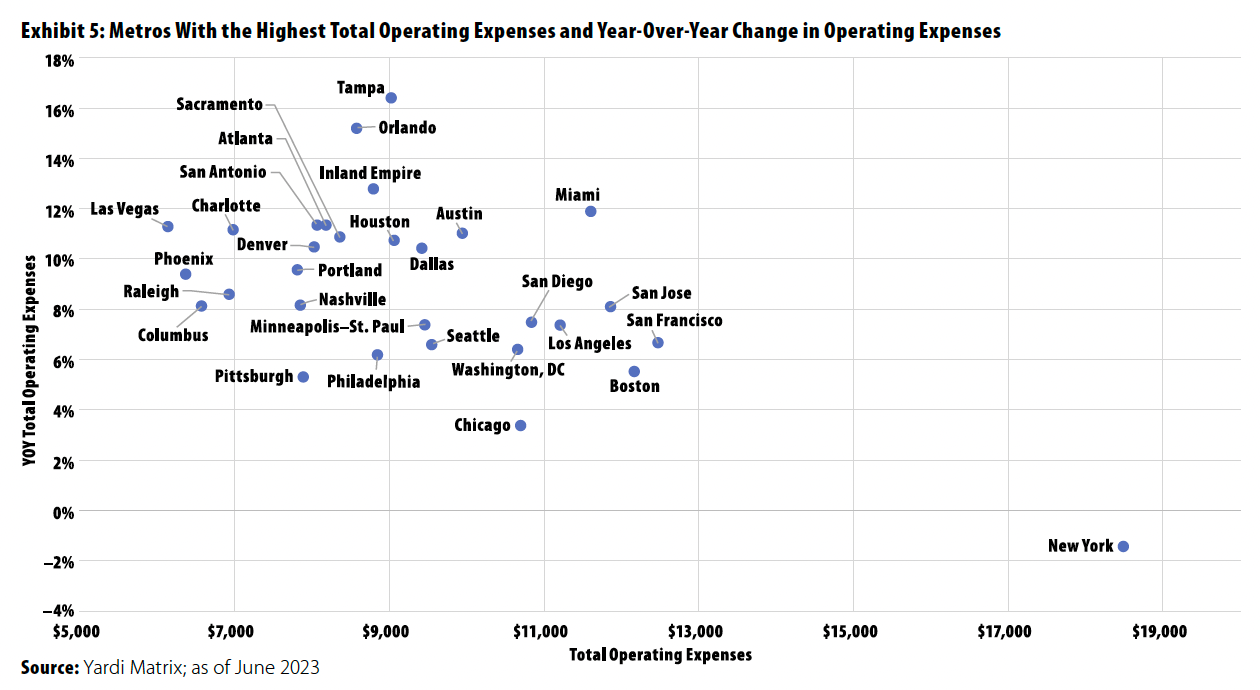
The biggest increases in expenses over the past year were recorded in small metros, led by Huntsville, AL, where expenses increased by 20.0% (Exhibit 4). Other tertiary metros with large increases included Spokane, WA (18.5%); Honolulu (17.7%); South Dakota (17.3%); and South Bend, IN (16.6%). Exhibit 5 shows that large metros with the highest increases in expenses were Tampa (16.2%), Orlando (15.1%); Inland Empire (12.8%); and Miami (11.9%). Thirteen of the top 30 metros and 54 of the 121 metros surveyed registered expense increases of 10% or more.
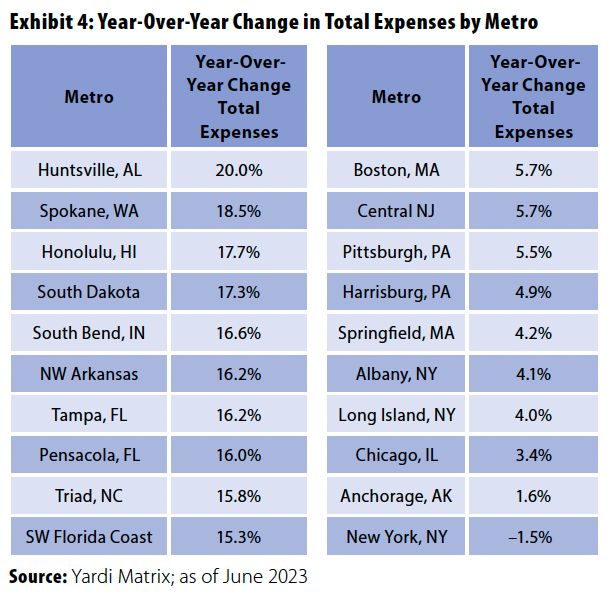
Seven of the ten metros with the smallest increases in expenses were in the Northeast, including New York City (–1.5%); Long Island, NY (4.0%); Albany, NY (4.1%); Springfield, MA (4.2%), and Harrisburg, PA (4.9%). Other major metros with among the lowest increases were Chicago (3.4%), Pittsburgh (5.5%), and Boston (5.7%).
As mentioned earlier and shown in Exhibit 1, regionally, multifamily expense growth also reflected national inflation trends, as costs rose the most in regions with rapid economic and population growth, led by the Southeast and Southwest. Expenses grew less rapidly in the West, Midwest, and Northeast. Despite the growth, expenses remained lower in the regions with the highest year-over-year growth. Properties in the Northeast had the highest per-unit expenses, followed by the West, Southwest, Southeast, and Midwest.
Large metros with the highest year-over-year increases in expenses generally still had lower total expenses per unit than large coastal metros with high costs. For example, expenses in Tampa rose 16.2% year over year but still averaged $9,024 per unit, less than half the $18,484 per unit in New York City, where expenses fell by 1.5% year over year. Other examples include Orlando, where expenses rose 15.1% year over year while total expenses per unit were below the national average at $8,577; Las Vegas, where expenses rose 11.0% year over year and total expenses per unit were $6,136; and Charlotte, where expenses grew 10.9% and average per-unit costs were $6,981.
The list of metros with the highest costs—where per-unit expenses topped $10,000—was dominated by coastal gateway and primary markets. Average per-unit expenses were almost 50% higher in New York City than San Francisco ($12,468), which had the second highest total expenses of major markets. Other high-cost metros include Boston ($12,164), San Jose ($11,863), Miami ($11,609), and Los Angeles ($11,204).
Secondary/tertiary markets with the highest per-unit expenses include Honolulu ($14,447), Northern New Jersey ($13,561), and White Plains, NY ($12,323). Metros with the lowest per-unit expenses were Greenville, NC ($4,988); Little Rock, AR ($4,971); and Northwest Arkansas ($4,518). Among the top 30 metros, Columbus ($6,574), Phoenix ($6,376), and Las Vegas ($6,136) had the lowest expenses.
Growing Problem With Insurance
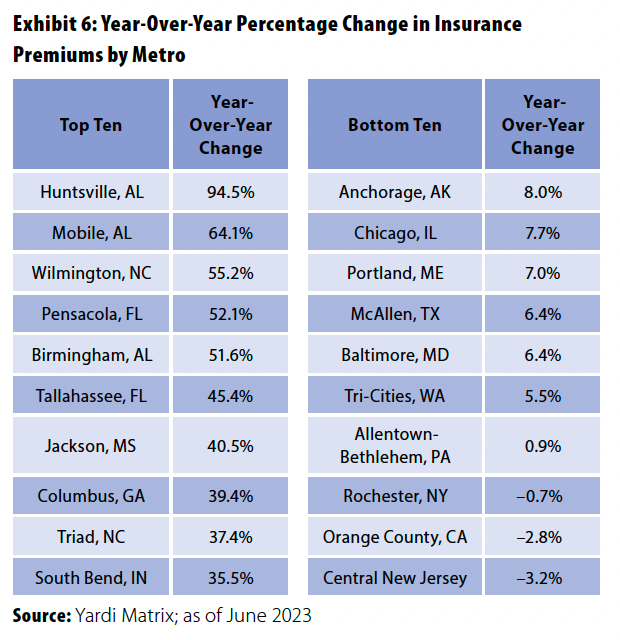
Leading the increase in expenses is an eye-popping surge in insurance costs. Ten of the top 30 metros and 51 of the 121 metros surveyed registered 20% or more year-over-year increases in insurance costs in the period studied, and 27 of the top 30 metros and 103 of the 121 metros saw premiums rise by 10% or more.
As shown in Exhibit 6, small metros in the Southeast were hardest hit by increases in insurance premiums, led by Huntsville, AL (94.5%); Mobile, AL (64.1%); Wilmington, NC (55.2%); Pensacola, FL (52.1%); Birmingham, AL (51.6%); Tallahassee, FL (45.4%); and Jackson, MS (40.5%). Among major metros, the largest year-over-year increases were in Orlando (34.5%); Houston (31.6%); Tampa (28.8%); San Antonio (27.7%); and Miami (25.8%). In only four markets—Allentown-Bethlehem, PA (0.9%); Rochester, NY (–0.7%); Orange County, CA (–2.8%); and Central New Jersey (–3.2%)—did insurance costs increase by less than 5.5%.
Insurance costs are rising chiefly because of the growing number of significant weather-related events, such as hurricanes, extreme temperatures, and wildfires, that have created large insurer payouts, particularly in states such as Florida, California, and Texas. In 2022, the US had more than $100 billion in weather-related damages, with $60 billion of insurable losses, according to Raghuveer Vinukollu, head of the Climate Insights and Advisory group for Munich Re US. Speaking at the Affinity Research Committee meeting at PREA’s 33rd Annual Investor Conference, held in October, Vinukollu said that through three quarters of 2023, the US already had more than $50 billion of insurable losses from severe convective storms.
As losses mount, reinsurers are raising rates they charge to insurance companies. Reinsurance rates increased by 35% in 2023, the largest increase in 17 years, according to the Guy Carpenter US Property Rate on Line Index. The reinsurance rate index, which reflects price increases, has almost doubled over the past six years, per Guy Carpenter. The rising number of losses is prompting some insurers and reinsurers to drop or think about dropping property casualty businesses in some states.
The issue is complicated by the fact that each state has its own set of regulatory hurdles. States such as California prohibit insurers from using future loss projections when setting rates. Seeking to avoid an exodus of insurers, California regulators recently announced reforms in which insurers would be allowed to use forward-looking models while also taking into account fire safety and mitigation efforts. Florida accounts for 11% of all insurance claims in the US but also represents about 80% of the claims and legal costs of insurers, according to the Florida governor’s office. As insurers leave the state, many residential property owners are forced to apply to Citizens Property Insurance, a state-backed insurer of last resort.
Although the biggest jump in the cost of insurance is from weather events, other cost drivers include increases in construction costs from inflation, labor, and supply chain issues, as well as the growth in property values. Consequently, insurers are increasing scrutiny of payouts and using third-party valuation services to assist in property-level underwriting. The challenging environment also has furthered compliance by servicers and increased waiver write-ups and submissions to lenders.
Industry advocates have started calling for lender reform, saying that properties are often overinsured to cover extreme losses that rarely occur. Commercial property lenders usually require owners to carry windstorm insurance for the full value of the property or at least the mortgage balance. The requirement is not burdensome where insurance is inexpensive, but escalating rates create hardships for some owners. Meanwhile, property insurance rates are increasing while policies cover less and have increasingly high deductibles. The upshot is that though insurance premiums might not increase 19% every year, above-trend growth seems likely in the near future.
Focus on Cutting Costs
Putting the cost growth in perspective is important. Operating expenses represent about 43% of gross income, per Yardi, and income in recent years has grown more than expenses. Asking rents have increased 59% nationally since the beginning of 2013 and about 23% since the beginning of 2021, per Yardi. Rent growth has been driven by demand outstripping supply, especially in the wake of the pandemic recovery; when household formation soared, there was robust migration to the Sunbelt and suburbs, and people who worked remotely sought more space.
Multifamily absorption hit a record 600,000 in 2021 and has remained healthy since. Year-to-date through August 2023, nearly 200,000 units were absorbed and rent growth remained positive in most markets, up 0.8% year over year through Sept. 2023, per Yardi. The national occupancy rate for stabilized properties was 95.0%, per Yardi, below cycle highs but solid by long-term standards.
Of course, not every property owner has strong performance or the benefit of long-term rent growth. The pain of expense growth will be felt most acutely by the cohort of property owners who bought value-added multifamily properties in 2020 through early 2022 at low acquisition yields with short-term mortgages. A record $45 billion of collateralized debt obligations was issued in 2021, with $28 billion of that backed by multifamily properties. Many of these properties are underwater and have loan maturities coming up within the next year.
Beyond the property-level impact is the question of whether the recent growth in expenses is temporary or the start of a longer-term trend. The answer may depend on whether the factors that cause the higher costs are transitory or structural. Inflation that was caused or exacerbated by transitory factors—such as supply chain disruptions that have moderated—is likely to decelerate quickly. Cost increases that result from structural causes may persist at above-trend levels. Insurance premiums, for example, are likely to continue to rise rapidly, as the number of storms that create major property damage has grown exponentially over the past decade. Another example is labor costs, which could continue to increase as the US faces a shortage of prime-age workers as a result of the aging population.
Given expectations of declining property values and a weakening economy, commercial property owners must focus on paring expense growth if they want to maintain profits. That includes a range of strategies, including improving energy efficiency and integrating technology that helps reduce administrative costs. 
Paul Fiorilla is Director of Research at Yardi Matrix.
This article has been prepared solely for informational purposes and is not to be construed as investment advice or an offer or a solicitation for the purchase or sale of any financial instrument, property, or investment. It is not intended to provide, and should not be relied on for, tax, legal, or accounting advice. The information contained herein reflects the views of the author(s) at the time the article was prepared and will not be updated or otherwise revised to reflect information that subsequently becomes available or circumstances existing or changes occurring after the date the article was prepared.