PREA Quarterly Feature - Spring 2024


 Kenneth T. Rosen
Rosen Consulting Group
 Randall Sakamoto
Rosen Consulting Group
 Max Hall
Rosen Consulting Group
Market participants have noticed the recent disconnect between public and private market real estate values. During periods of economic volatility and interest rate fluctuations, public markets reprice with greater speed than the private real estate market. In the current cycle, interest rate hikes combined with speculation of an economic recession helped create a bearish sentiment among public market investors. As a result, public market values such as Nareit price indices declined rapidly during the 18 months following the start of the Federal Reserve’s rate hikes and remained far off peak values into 2024.
However, private market values, particularly assets in open-end funds, are appraisal based, moving more slowly and often with lagged inflection points relative to public markets. This is largely because real estate appraisals in the US rely heavily on past free-and-clear transactions to determine the value of an asset. But transaction activity has been sluggish for more than a year, providing appraisers with few relevant comparables. While private values have started to decline, the gulf remains wide between the public and private markets. In fact, some property types have had no decline in value since 2021. The notable exception is the office sector, where both private and public markets reflect significant declines in value.
More broadly, the lag in private market values has raised significant questions and concerns across the marketplace: How does this lag affect redemption queues for open-end funds? Does this environment create an arbitrage opportunity between private market funds and public market REITs? What questions should the industry ask to help close the gap in values going forward?
Historical Context
Redemption queues are similar to the queues that occurred during the global financial crisis. However, two years since the beginning of the drop in commercial property values in the public market, some funds have only just begun to recognize value losses. During the financial crisis, asset values were written down by 2008 or 2009, and redemption queues began to reverse by 2010. The value and transaction volume decline were much steeper during that period, yet the peak-to-trough-to-nascent stabilization occurred faster than in the current cycle. Then as now, public market value indicators also led by about a year. Most market participants agree that property values are lower than appraised values and the time line to write down values has taken longer than following the financial crisis.
Is this time different? Although the answer is no, things are not that different from the past. So if the underlying relationships between public and private market values persist, what is behind the longer lag?
Comparing Queues
Current redemption queues have been estimated at roughly 15% of net asset value (NAV) of open-end funds. The Townsend Group estimated more than $52 billion of potential outflows at the end of 2023, a record level at the time.1 The queues have grown since then, from both additional investors seeking redemptions and fund managers unable to satisfy existing requests given available cash and other considerations.
In general, open-end funds are not required to sell assets or take actions that could be negative to the real estate portfolio in order to satisfy redemption requests. In addition to the difficulty of raising capital when an exit queue exists, some funds are prohibited from making new investments if queues reach a threshold. Of course, the balance between long-term returns and short-term liquidity is precarious in a volatile real estate market. Though green shoots are emerging on the leasing demand side, few factors exist to indicate a quick resolution to the redemption queues.
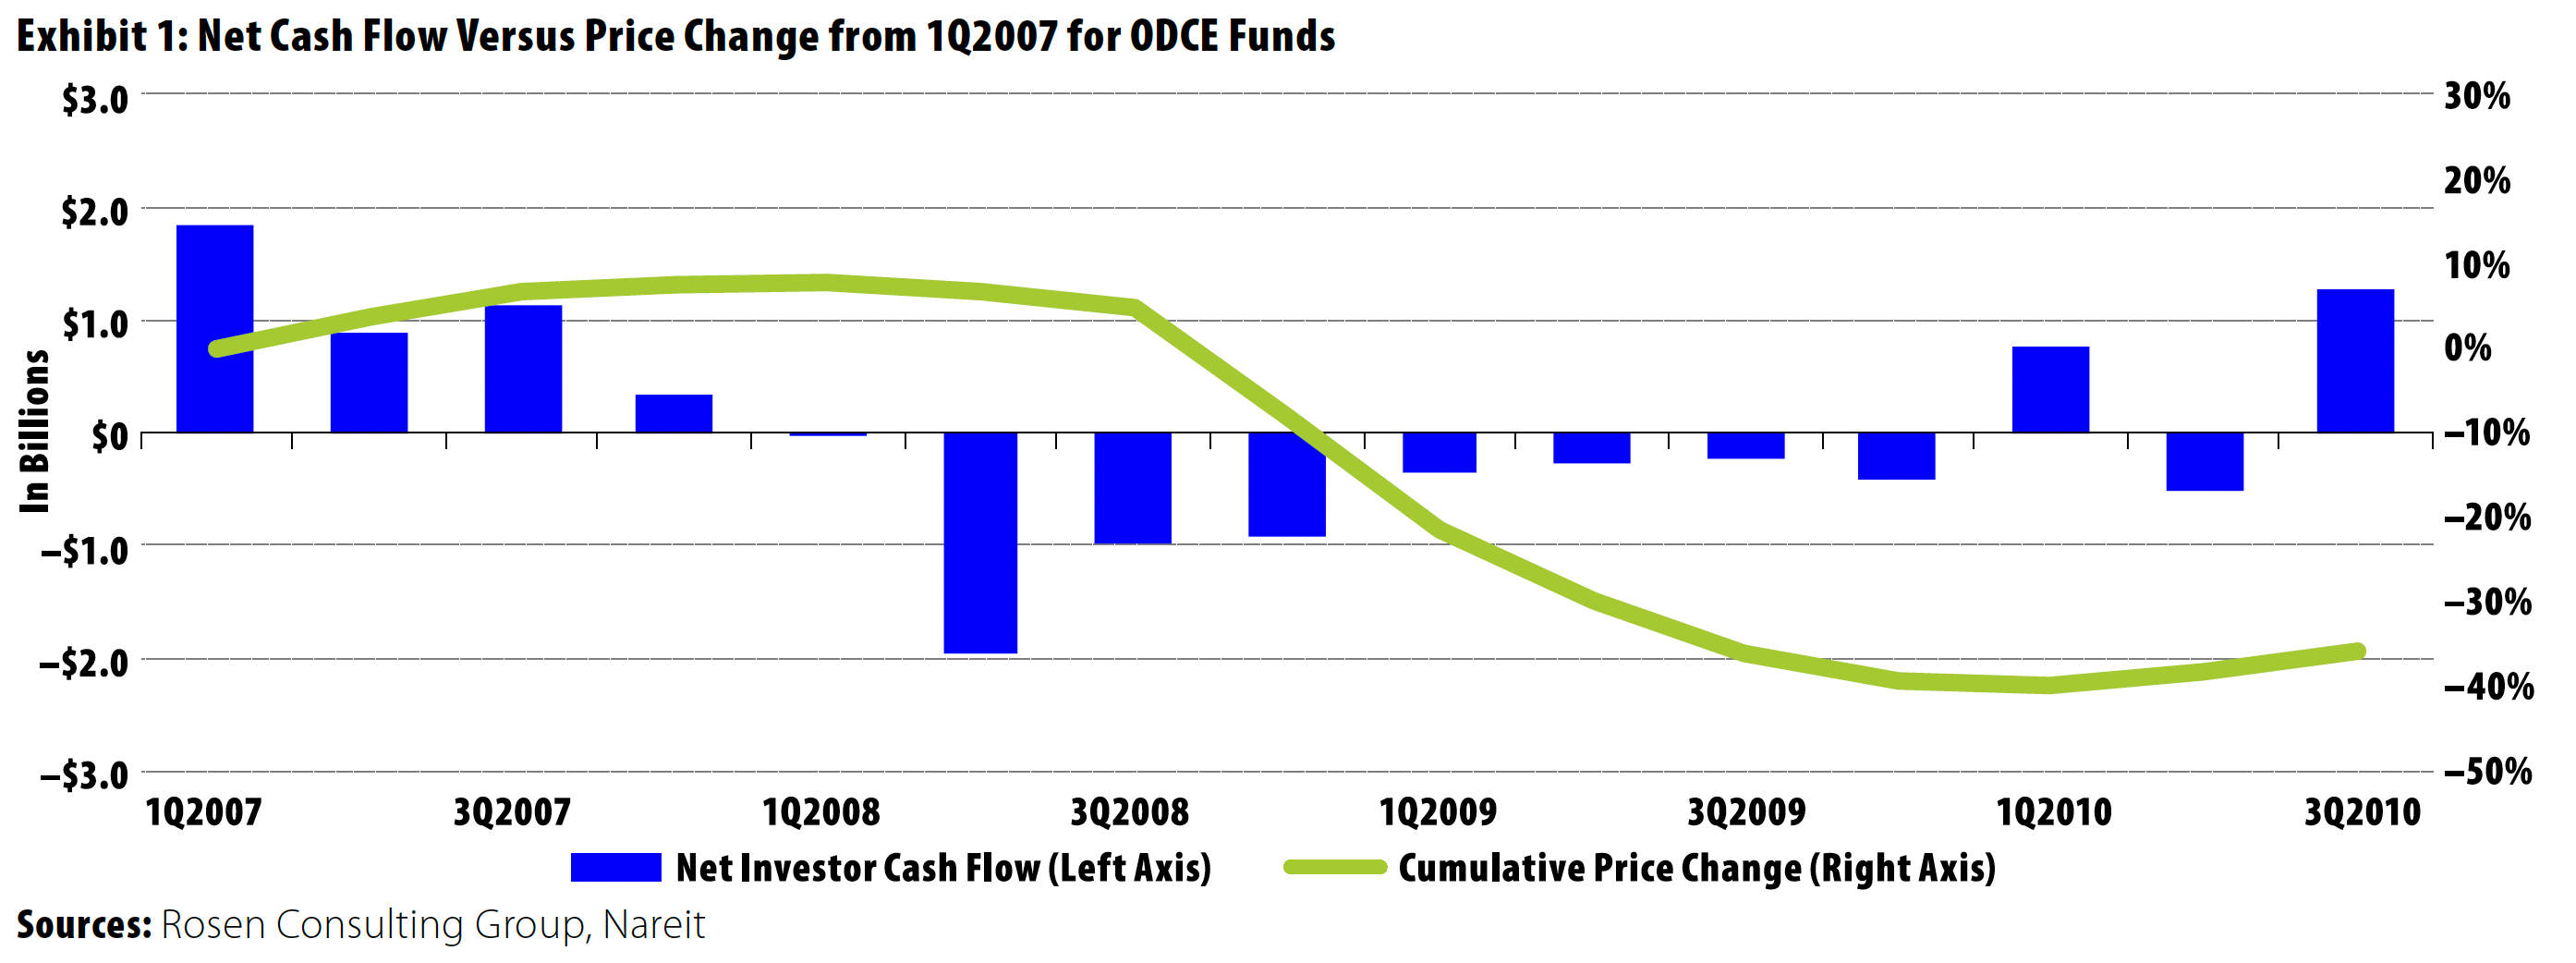
By the end of 2008, estimates of redemption queues reached 10% of NAV. The queues peaked at roughly 20% a year later, but they notably reached this point much sooner than expected given the state of the broader economy. Though there was some variation, most funds recognized the decline in asset values within approximately 18 months after the initial downturn, and redemption queues peaked around the same time. In some cases, by 2010 redemption queues had dispersed and some funds had a net inflow of capital (Exhibit 1).
In comparison, more than two years into the current cycle of declining asset values, many funds have recognized only minor asset value declines. And it appears several more quarters of value declines may be necessary to approach market values. To be fair, most funds tend to be relatively liquid during growth cycles, but that liquidity can dry up quickly when volatility emerges.
The growing redemption queues, as well as suspensions or limits on redemptions imposed by fund managers, have frustrated investors. While no investor wants to recognize a greater loss, investors also do not want to lose their liquidity. Specifically, open-end funds can offer greater liquidity than other fund structures, and the redemption limitations reduce or eliminate that attribute.
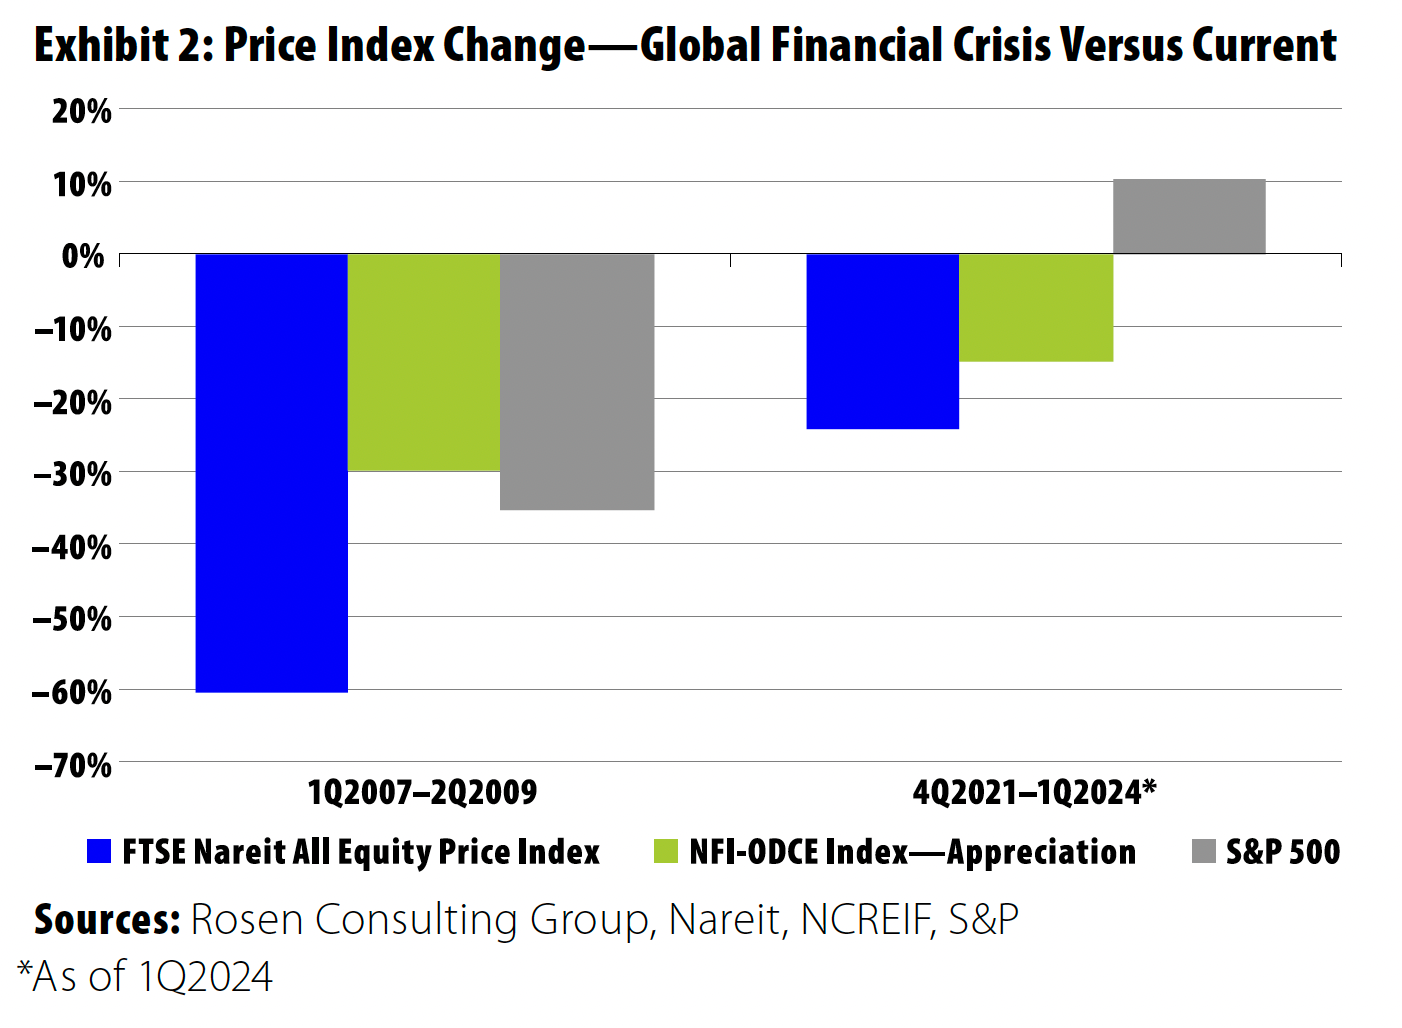
Another aspect of open-end funds is they engage independent appraisals on a quarterly or an annual cycle, with internal valuation adjustments on the non-appraised assets. This implies at least an annual mark-to-market of asset values, which is not quite the outcome today (Exhibit 2). With nearly all open-end diversified core equity (ODCE) funds appraised by just two firms, similar assumptions and preferred indicators may be reducing the diversity of valuations. Adding to investor frustration, other asset classes are producing positive returns and instilling investors with the fear of missing out, a much different environment than during the financial crisis, which is leading to additional investor frustration.
Why Aren’t Values Moving (as Quickly) as Expected?
The lag in appraised values in private real estate markets is one reason. Appraisers rely on comparable transactions to value real estate assets, and few assets are trading. During the financial crisis, unencumbered transactions came to a halt, but foreclosures, special servicing transfers, and portfolio workouts helped set a framework for values. In today’s environment, loan extensions and modifications have prevented many of the distressed situations that created values for comparison during the financial crisis.
The appraisal lag for private real estate is well documented.2 During economic downturns or capital market weakness, real estate transaction volume typically slows. As a result, the market clearing price can become difficult to ascertain. This uncertainty or lack of comparable transactions can cloud the appraisal process, which uses comparable sales as a primary input to establish asset values. However, the lack of transactions does not hamper all valuation processes in the same way. The public REIT market as well as transaction-based indices can be more responsive to asset value inflection points and can even be leading indicators of private market values.
The recent dearth of unencumbered transactions has produced a more significant lag in appraised values. As a comparison, the financial crisis provides similarities. The decline in transaction velocity was more severe during the crisis, with a peak-to-trough decline of more than 90% by 2009, according to MSCI Real Capital Analytics. Roughly two years into the current down cycle, transaction volume is down by two-thirds. There is also significant variation in types of property selling, with few office buildings sold yet these account for some of the largest value declines. Today, there are more transactions relatively speaking, and there is less volatility throughout the economy than in 2008 and 2009, which should translate into a tighter consensus in the direction of asset values.
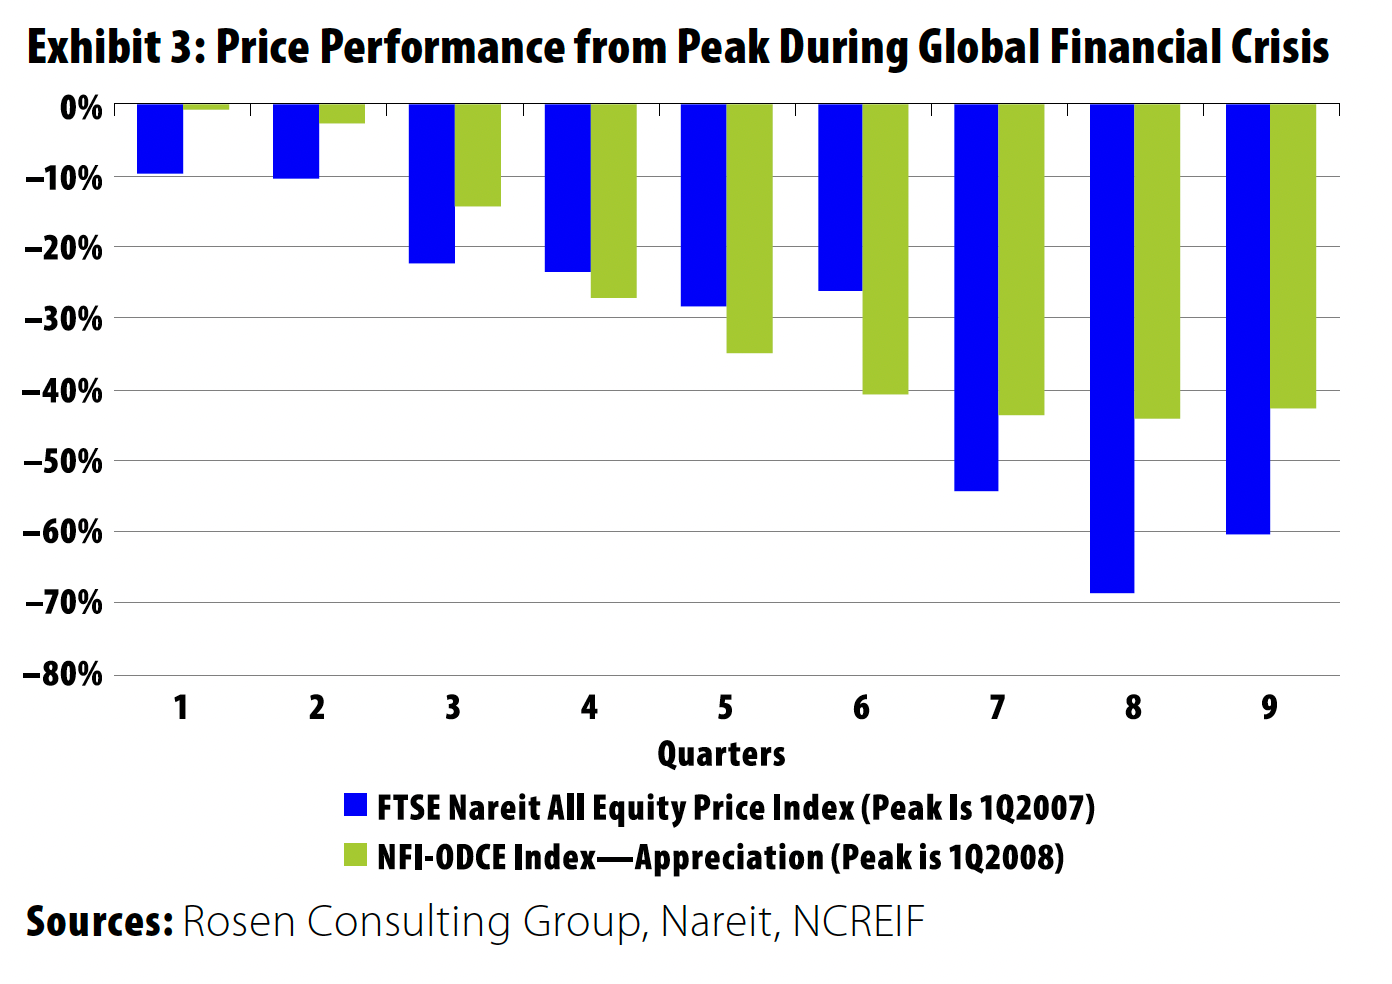
Additionally, the appraisal lag during the financial crisis underscored that liquid public markets can directionally lead the asset value trends (Exhibit 3). The FTSE Nareit All Equity REITs price index peaked in early 2007 and declined by roughly 70% over the next two years. However, the NCREIF Fund Index—Open End Diversified Core Equity (NFI-ODCE) began to decline roughly one year later, in the first quarter of 2008. The trough in values of that index was shallower than the public markets and took approximately two years to reach as well. By the time the NFI-ODCE index reached its trough, the FTSE Nareit index had already begun to recover.
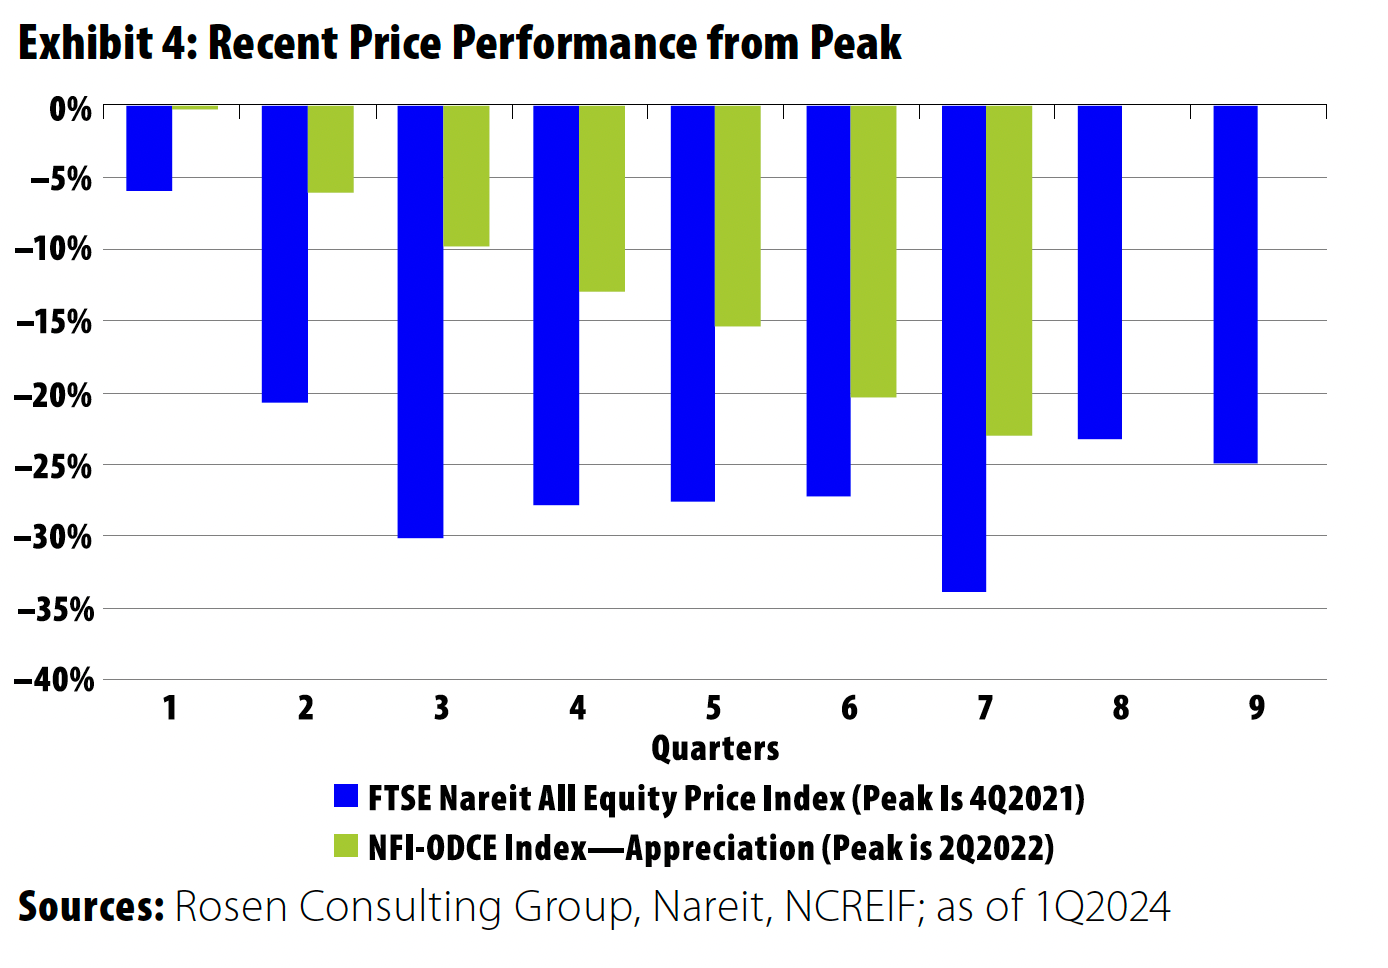
The current environment shows remarkable similarities (Exhibit 4). By early 2024, the FTSE Nareit price index was roughly 25% lower than the peak at year-end 2021. Meanwhile, the NFI-ODCE was 23% lower than the peak reached in mid-2022 and 15% less than the year-end 2021 level. The difference between the peak index values was two quarters shorter compared with the difference during the financial crisis. It remains to be seen if the lag between the trough in the REIT index and that of the NFI-ODCE will also be similar.
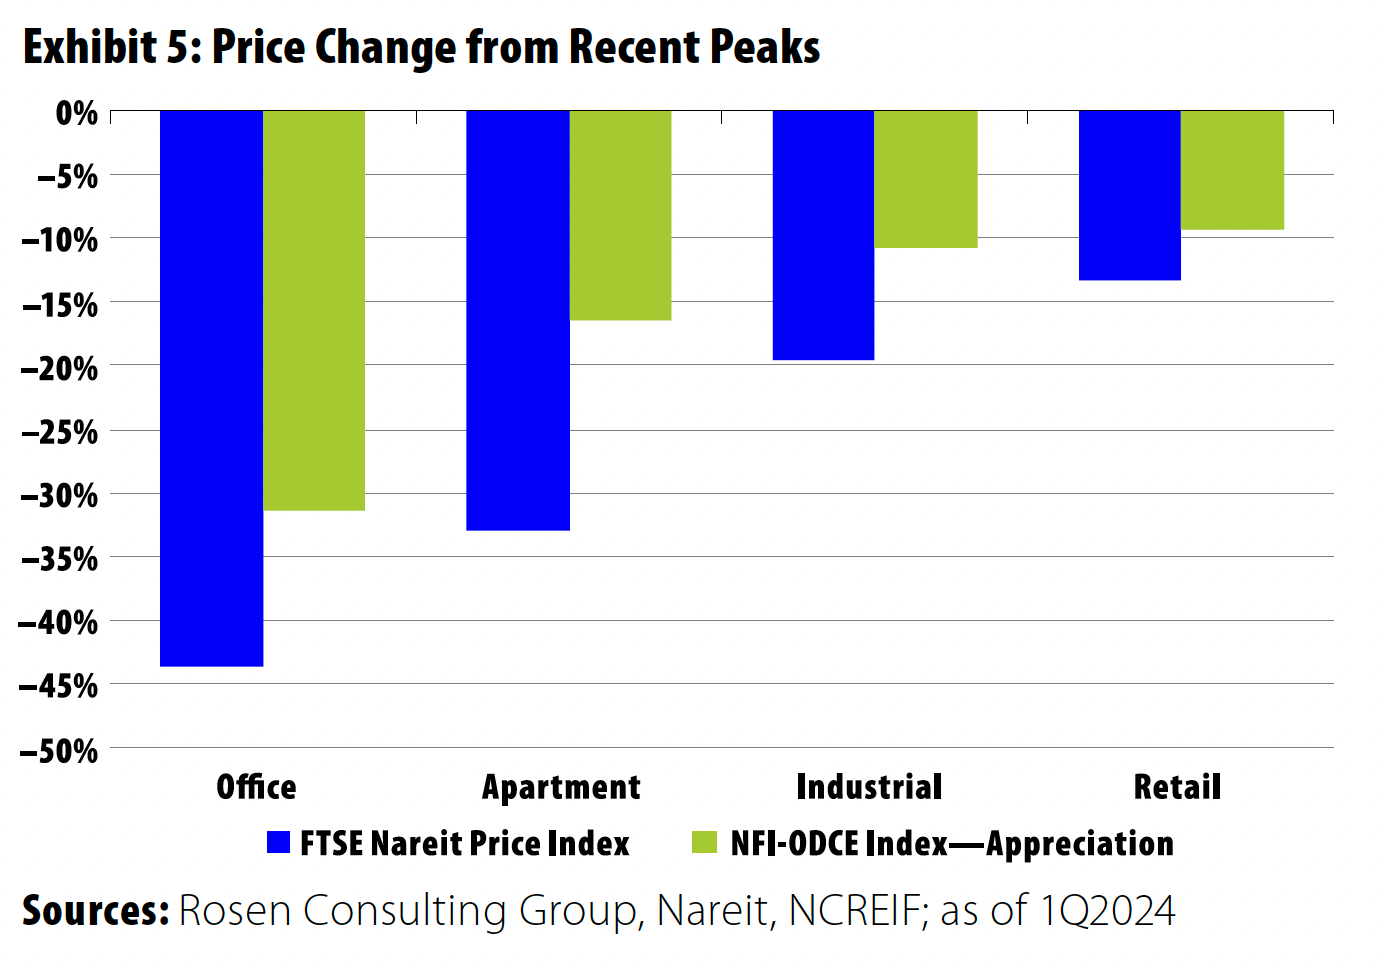
While several similarities exist, differences in the two indices explain some of the divergent trends (Exhibit 5). The property-type composition is substantially different between the two indices, and value declines are much more pronounced in the office sector than in the other sectors. But more broadly, the difference in values by property type undercuts the similarity in headline pricing between the two markets. The property-type REIT indices were much lower relative to peak values than private markets. In some cases, the public markets imply a greater decline to come of more than 10%. As a liquid vehicle, REITs also tend to be somewhat correlated with the equity market. In fact, this may help explain why the FTSE Nareit index began a nascent recovery as the record-setting pace of the stock market lifted all ships, at least in the public market.
Although both appraisal methods generally point to a decline in property values, the extent of the decline is unclear. This is particularly the case given the rapid shifts in consensus outlooks for interest rates, which impact discount rates and exit cap rate assumptions. Furthermore, the lack of transactions muddies a sales comparison approach.
In Europe, where the appraisal process differs from US methods, the initial correction in real asset values has already occurred. Though the economic outlook for much of Europe is more pessimistic than for the US, property market expectations are more optimistic. By the first quarter of 2024, survey respondents expected stable to slightly positive capital appreciation in the UK, according to the Royal Institution of Chartered Surveyors, in part because of the asset value declines the previous year.
Public markets may provide a leading indicator of asset values. While the day-to-day liquidity of the equity markets and quarterly reporting cycle can drive volatility, REITs can prove to be a directional bellwether.3 Over the past 20 years, public market trends have led those of private real estate by roughly a year. REIT NAVs were down by roughly 40% peak to trough, though pricing has since rebounded. Private real estate in general, and open-end funds in particular, have yet to mark down asset values by nearly as much. This implies not only that private market asset values may decline further but also that the bottom may be near. Although private real estate should not move as quickly as liquid public markets, in this case the public market signaling may ultimately be a positive for the private markets.
The uncertainty of asset values as well as the comparative difference in real asset values in the public and private markets adds to the outflow of capital from open-end funds. Some investors may take advantage of the appraisal lag during times of dislocation to realize gains or mitigate losses.4 The arbitrage opportunity sticky valuations create may add to the redemption queues. An investor thinking that the public market price of real estate reflects a true decline could pull out investments from an open-end fund that has yet to realize the full value loss. To use the current market as an example, if investors believe that real estate value declines are in line with those of the public markets of roughly 25% but can redeem their fund investments with only a 15% decline in value during the same period, the investors may withdraw larger amounts of capital than they would otherwise at a 25% loss. In part because of this difference, fund redemption requests continue to increase, not only lengthening queues but also hindering fundraising efforts and removing some open-end funds from the property transaction market. Convergence between private and public market values might reduce this arbitrage, helping to stem the outflow from open-end funds.
Comparing trends during the global financial crisis in the US and UK, the two most transparent real estate markets in the world, shows how early value write-downs can be like the quick pain from ripping off a bandage quickly rather than prolonged pain from doing it slowly. In the UK, fund property values dropped quickly and severely in 2008, driven by forced sales as a result of investor redemptions. Compared with the US fund structure, UK managers typically have less flexibility in determining when to meet redemptions. The transactions provided property valuers with comparable sales with which to value the remaining assets. Additionally, UK open-end funds undergo monthly appraisals. The frequency of valuation as well as the greater liquidity drove the early recognition of value loss. On the other hand, while some US funds have defaulted on loans, many have been able to retain assets as lenders have extended and modified terms rather than taking keys. With fewer sales in the US to provide appropriate comparables, asset repricing has taken longer than in the UK. Most UK property valuers proactively lowered values in 2023, and the length of time for asset values to reset in the US has been longer than it was following the financial crisis.
Determining asset value through property appraisal is complex when markets are functioning and nearly impossible when no trades are occurring. Valuation professionals must derive the value of an asset from data and evidence while identifying market factors that will have a more lasting impact on values. Appraisers are a key part of the fund investment process, and their value is underscored during times like these.
No Easy Solutions
Clearly, the lag between public market and private market asset values is having an outsize impact on redemption queues, but what can be done?
The most important factor is a clear dialogue between participants—investment teams, investors, and members of the appraisal community. When the market is functioning, traditional methods have worked well and should continue to be utilized. However, in volatile periods or when markets seize, extraordinary measures may be needed. Unfortunately, these periods seem to arise with greater frequency, underscoring the importance of recognizing that processes might need improvement across the board.
No single solution exists regarding the issue of appraisal lags and redemption queues, though the issues are very much intertwined. Ideas for consideration include these:
- Altering core principles of the appraisal process is not the answer, of course. However, given the unique market environment, encouraging appraisers to utilize their full toolkit rather than relying heavily on the comparable sales method would help reduce the appraisal lag. Greater emphasis on the discounted cash flow method would have resulted in greater asset value declines earlier in this cycle. This was apparent in much of Europe, where discounted cash flows are leaned on more heavily.
- Taking another page from the European valuation standards, greater flexibility could be given to US appraisers to identify an estimated “fair value”—that is, an estimated value between participants in an actual or a potential transaction possessing full knowledge of relevant facts in the absence of comparable sales. Most appraisal standards in Europe allow for greater flexibility in utilizing indicators when there are few comparable transactions. The UK utilized this method heavily, which played a factor in the write-down of asset values earlier and more substantially than in other parts of Europe and the US.
- Perhaps greater utilization of existing tools and methods may be another way to help solve the appraisal lag. One such tool is the band of investments method, which accounts for a weighted cost of debt capital and equity. This method calculates debt and equity components, which can then be combined into an overall cap rate to appraise a property’s value.
- Given the lack of transactions, investment teams may have opportunities to write down portfolio values quicker without directly conflicting with portions of the portfolio that are appraised in a given quarter. Of course, guardrails would need to be implemented to maintain appraisal independence as well as to discourage managers from adjusting values higher to boost performance.
With the current economic outlook and interest rate expectations, further declines in property values should be expected this year and possibly into 2025. Clearly, it will take some time for appraised values to fully reflect today’s market conditions. As long as the perception of arbitrage between market values and fund asset values persists, redemption queues will remain high. The long queues will keep open-end funds on the sidelines, removing a large set of buyers that could go a long way to unlocking the transaction market and helping real estate values stabilize . 
1. Rob Kochis and Nick Moné, “Negative Fundraising: Redemption Queues in Open-End Commingled Funds,” PREA Quarterly, Winter 2024.
2. Edward F. Pierzak, “Public and Private Real Estate: Divergence, Resurgence, and Convergence,” PREA Quarterly, Fall 2023, and Richard Kalvoda, Robby Tandjung, and Omar Eltorai, “Exploring the Public-Private Gap: When Price and Value Diverge,” PREA Quarterly, Winter 2023.
3. Greg MacKinnon, “Which Way for Appraised Property Values? Looking to Other Real Estate Indices for Clues,” PREA Quarterly, Spring 2023.
4. Pierzak, “Public and Private Real Estate.”
Kenneth T. Rosen is the Chairman, Randall Sakamoto is the President, and Max Hall is a Senior Associate at Rosen Consulting Group.
This article has been prepared solely for informational purposes and is not to be construed as investment advice or an offer or a solicitation for the purchase or sale of any financial instrument, property, or investment. It is not intended to provide, and should not be relied on for, tax, legal, or accounting advice. The information contained herein reflects the views of the author(s) at the time the article was prepared and will not be updated or otherwise revised to reflect information that subsequently becomes available or circumstances existing or changes occurring after the date the article was prepared.