PREA Quarterly Feature - Winter 2022


Extraordinary Industrial Sector Outperformance
 Tim Wang
Clarion Partners
 Pedro Niño
Clarion Partners
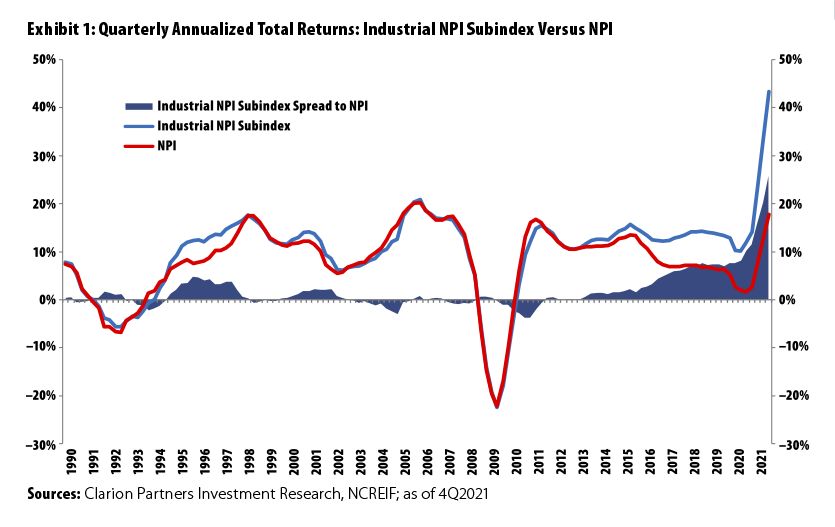
The time to be an owner of industrial real estate has arguably never been better. In 2021, the NCREIF Property Index (NPI) industrial subindex achieved a total return of 43.3%, the highest ever for any core property sector on record. The sector has outpaced the overall NPI since 2011 in a trend that predated but was accelerated by the COVID-19 pandemic (Exhibit 1). More impressively, over the past two years industrial performed two to three times as well as other core property sectors, a spread that has not been seen in NCREIF’s 44-year history.
Over the past ten years (41 quarters), industrial has achieved the second-longest continuous period of outperformance, quickly closing in on retail’s record of 45 quarters that ended in 3Q1994. Industrial has also achieved the greatest decade-long total return spread over the NPI benchmark by any of the four core property types since 1978, a record also previously held by retail. Given historically strong market fundamentals and landlords’ ability to raise rents, Clarion Partners’ short- and long-term outlook for the industrial sector remains bright. We continue to monitor several key demand drivers as well as potential risks on the horizon.
The Great Inventory Rebuilding
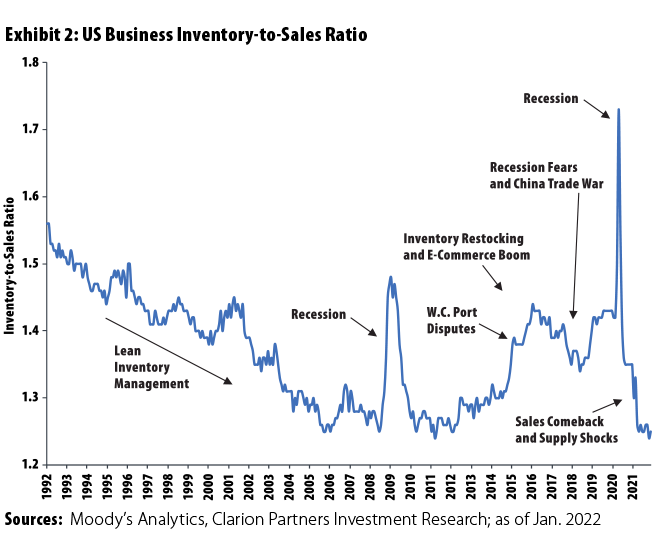
Over the past 30 years, US supply chains have progressively begun to reflect just-in-time inventory management strategies, characterized by declines in inventories as a share of sales (Exhibit 2). Technology and predictive analytics have played a significant role in this shift. The inventory-to-sales ratio previously bottomed out in 2011, but strong consumer trends coming out of the global financial crisis and the continued expansion of e-commerce added upward pressure for higher inventory levels.
The onset of the pandemic precipitated a rapid and unprecedented demand shock that interrupted normal business conditions. Many suppliers quickly scaled back production, sometimes unwillingly, because of government restrictions or COVID illness, leading to widespread inventory shortages and distribution delays. A synchronized global economic recovery is now well underway, which has put immense pressure on the intertwined and complex global supply chain. Although US retail sales are now 20% above pre-COVID levels, the inventory-to-sales ratio has fallen once again to an all-time low despite ongoing urgency to replenish stock. A flood of imports has created bottlenecks across US seaports particularly in Southern California (SoCal). In 2021, loaded TEU1 imports in SoCal were up 21% and 19% above 2019 levels. Other key ports in New York/New Jersey, Houston, and Savannah have also seen strong double-digit growth since the beginning of the pandemic. Imports, in turn, typically generate a disproportionate share of the demand for warehouse space because imported goods must be landed, stored, transported, and distributed to businesses or homes, while exports tend to go directly from domestic factories to ports.
Following these disruptions, the great inventory rebuilding will be a significant near-term boost for warehouse demand. Inflation-adjusted inventory in the US is still more than 3.0% below January 2019 levels, suggesting that inventory would need to expand by that much to simply return to pre-pandemic levels and an additional 4% to 6% to return to its pre-COVID growth trend. In addition, deeply scarred businesses may be compelled to choose to increase inventories slightly higher to hedge against possible future disruptions, moving away from just-in-time to “just-in-case.” A lesson learned during the pandemic may very well be that the opportunity cost of losing a sale, or the profit that would have been made plus any repeat business, may outweigh the inventory carrying costs. According to CBRE, a 5% increase in business inventories is consistent with an additional 400 million to 500 million square feet (sf) of warehouse occupancy, which highlights the potential upside for future industrial demand.
The Continued E-Commerce Boom
The ongoing expansion of e-commerce logistics is by far the largest secular tailwind for industrial demand. A business-to-consumer distribution model is far more complex and costly than business-to-business commerce. Consumer expectations for greater product variety and faster delivery speeds have grown exponentially over the past decade. E-commerce users typically utilize about three times as much warehouse space as traditional retailers. Every $1 billion of new e-commerce sales growth requires 1.0 million sf of additional warehouse space.
The pandemic dramatically accelerated the recent pace of US e-commerce sales. Growth reached as high as 44% year over year in 2Q2020, during the height of social and business restrictions, leading to annual growth of 32% in 2020. All considered, the pandemic has resulted in more than $190 billion of extra online spending since 2Q2020 (with extra spending defined as the amount above the expected 15% annual growth). This translates to about 190 million sf of occupancy solely based on the unexpected surge in e-commerce. Nonetheless, while e-commerce growth will likely normalize as the economy continues to fully reopen, e-commerce levels will remain above pre-COVID projections. The pandemic created millions of first-time online buyers in a matter of months, many of whom have grown accustomed to the convenience of online shopping. Online sales now account for about 20% of total core retail sales (as of 3Q2021), up from 6% in 2010, and could grow to about 30% by 2030. By 2025, total US e-commerce sales are forecast to exceed $1.0 trillion, double the $500 billion just three years ago. Consequently, an estimated 225 million sf of new space will be needed over the next five years (2022–2026) to accommodate e-commerce expansion alone, including as much as 80 million sf of new space for “reverse logistics” to handle the proportionate growth in returns.
Strongest Fundamentals on Record
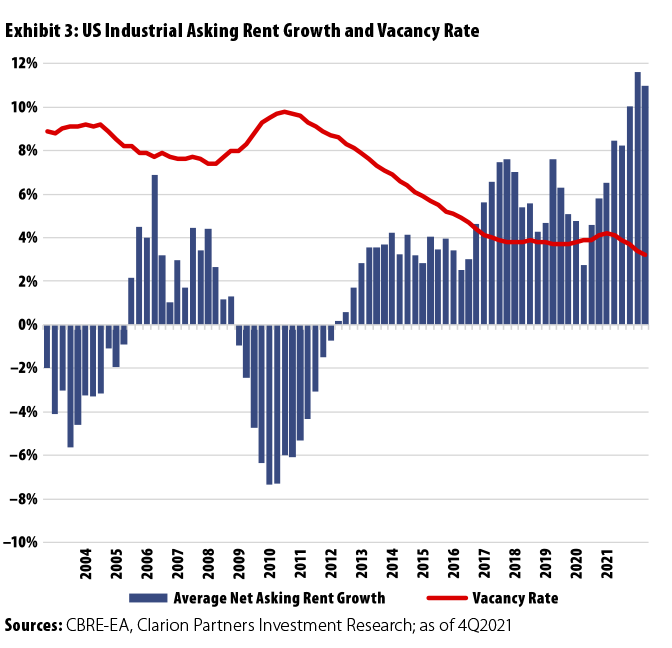
With widespread all-time low vacancy across many markets, the US industrial market is essentially fully occupied and rents are soaring (Exhibit 3). New leasing activity remains robust, and about 35% of product under construction has been pre-leased.
- Vacancy at All-Time Low. As of 4Q2021, US industrial vacancy reached a record low of 3.2%, well below its long-term average of 6.7%. Today, SoCal has the lowest vacancy rate nationally, at 0.7%, with Class A warehouse vacancy at only 0.2%.
- Demand Outpacing New Supply. Since 2010, nearly 3.2 billion sf of industrial space has been absorbed compared to only 2.0 billion sf in deliveries. In 2021, the market net absorbed 433 million sf, well above the 268 million sf of new supply.
- Widespread Demand. Demand and rent growth have been strong for both smaller, light-industrial warehouses (largely used for regional and last-mile distribution) and big-box warehouses (generally middle or first mile). These two property types are largely complementary in the modern logistics network.
- Shortage of Class A Warehouse Inventory. While Class A warehouse net absorption has totaled 1.1 billion sf since 2015, or 52% of all industrial net absorption (and 61% of all warehouse net absorption specifically), the sector makes up only about 14% of industrial stock, or about 2.1 billion sf of the total 15 billion sf nationwide.
- Functional Obsolescence. Functionally obsolete stock generally features inadequate parking ratios, truck courts, clear heights, or dock door counts, all of which are key considerations for today’s high-throughput and efficiency-focused users. About 75% of total US industrial inventory was built before 2000, more and more of which surpasses the obsolescence threshold by the day. We conservatively estimate that 0.7% of today’s stock per year requires replacement—approximately 530 million sf over the next five years—providing a sizable development and redevelopment opportunity.
More Room for Rent Growth
In several relatively supply-constrained markets, such as SoCal and New York/New Jersey, lease rents expanded at 20% to 40% over the past year, and asking rents jumped 11% on average nationwide. Tenants remain willing to pay a premium for strategic but expensive sites with quick access to consumers and labor. According to CBRE, transportation costs typically account for 50% to 70% of an occupier’s total logistics spending, and fixed facility costs (including real estate rents) account for only 3% to 6% (Exhibit 4).
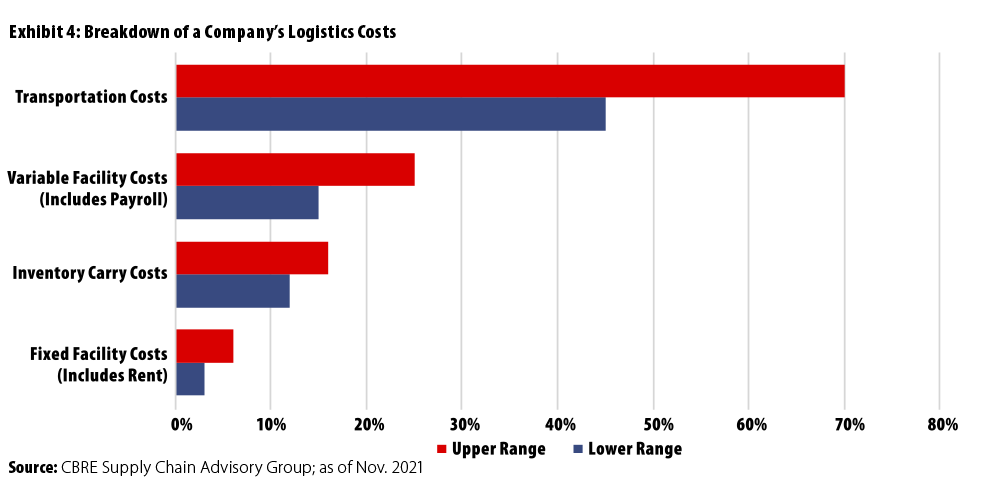
It takes roughly an 8% increase in fixed facility costs to equal the impact of just a 1% increase in transportation costs. It can therefore be a wise tradeoff for businesses to spend 10% to 40% more on rent to locate inventory closer to end consumers to save on increasing shipping costs, which have recently surged more than 60% above pre-COVID levels. This is illustrated by the continued record space absorption in many markets despite the recent surge in rents.
Potential Risks
Surging Inflation and Labor Costs
In January 2022, US inflation surged to 7.5%, the highest level since 1982. As industrial demand ultimately serves consumption, a pullback of consumer spending in response to rising prices will likely slow take-up of warehouse space. Rising wages may also affect e-retailers such as Amazon, which sharply increased pay for warehouse and delivery workers during the pandemic. If e-retailers pass on the additional costs to end consumers through new fees for delivery and returns, consumers may decide to spend less online and more in brick-and-mortar stores.
New Supply
With approximately 514 million sf of space under construction, 2022–2023 will likely see record-breaking supply completions, although an impressive 175 million sf (or 35%) has already been pre-leased. The remaining balance has the potential to lift vacancy to 5.3% if delivered entirely vacant, other things being equal. Even in that case, vacancy would still be 140 bps below long-term averages, and the last time vacancy was near that level (in 2014–2015), effective industrial rents grew about 4.0% annually. Furthermore, developing, especially in coastal markets and infill submarkets, is becoming increasingly difficult and expensive. Land and construction costs have surged by 20% to 35% over the past 18 months, adding to challenges posed by lengthy entitlement and permitting processes along with frequent local opposition.
Trade War
Tariffs on two-thirds of imports from China remain intact at an average rate of 19%. About 58% of US exports to China are also affected, with an average tariff of 21%. Such policies, along with persistent inbound shipping challenges, could potentially drive near-shoring/on-shoring in the future. Recent announcements by large firms such as Samsung, Intel, and Ford to spend tens of billions to expand domestic high-tech manufacturing are cases in point. Any significant shifts in global shipping routes and ports of entry could alter regional demand for industrial distribution space.
Outlook
Without a meaningful allocation to industrial, any real estate portfolio has been challenged to outperform the NPI over the past few years. Consequently, investor interest in US industrial assets has escalated to the point where the NPI industrial allocation has almost doubled from 14.4% in 2017 to 27.7% in 2021. Looking ahead, widespread inventory rebuilding, the continued development of modern e-commerce infrastructure, historically strong market fundamentals, and higher replacement costs will continue to drive growth within the logistics industry. Clarion Partners is optimistic about the near- and long-term appreciation and income growth potential for well-located, high-quality industrial investments. We believe the outperformance of the industrial sector will likely continue over the next few years.
1. TEU means “twenty equipment unit,” or a 20-foot container.
Tim Wang is a Managing Director and Head of Investment Research and Pedro Niño is a Vice President of Investment Research at Clarion Partners.
This article has been prepared solely for informational purposes and is not to be construed as investment advice or an offer or a solicitation for the purchase or sale of any financial instrument, property, or investment. It is not intended to provide, and should not be relied on for, tax, legal, or accounting advice. The information contained herein reflects the views of the author(s) at the time the article was prepared and will not be updated or otherwise revised to reflect information that subsequently becomes available or circumstances existing or changes occurring after the date the article was prepared.